How to read the isobar maps
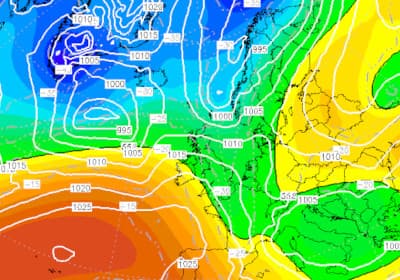
Isobar maps show the atmospheric pressure forecast, represented with lines (isobars) connecting points with the same pressure.
What isobars are
Each line represents a specific atmospheric pressure. When the lines are close together, it indicates a large pressure difference over a small area, which generates strong winds.
Lows and highs
Low-pressure systems (generally shown with cooler colours or lower values) generate the wind and swell that later reaches the coast as waves. High-pressure systems tend to bring stable weather and light wind.
How swell is generated
The swell that breaks on the coast is generated days earlier by the wind associated with these low-pressure systems out at sea. That's why isobar maps help anticipate the wave forecast with more lead time.