How to read the wave maps
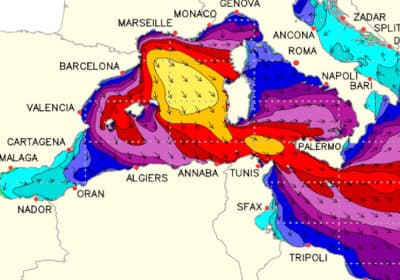
Wave maps show, visually on a map, the height and direction forecast for the swell over the coming days along the whole coast.
Colours and height
The colours on the map represent the forecast wave height: the more intense or warmer the colour, the bigger the waves in that area.
Direction arrows
The arrows show the direction the swell is coming from. They're very useful for knowing whether that direction will reach your area well, or whether it will be sheltered by the coastline.
Browsing by hour
Use the hour selector to see how the swell evolves over the coming days and get ahead of the best times to surf.
Different weather agencies
You can compare maps from different weather agencies: when several of them agree on a forecast, it's a sign of higher reliability.