How to read a spot's forecast
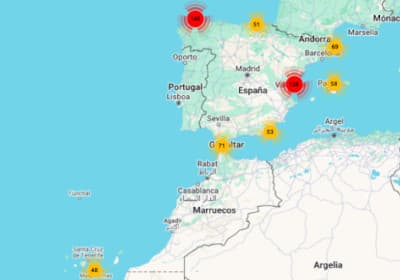
Each spot has its own page with real-time data and a forecast for the coming days, calculated from the nearest wave, wind and tide model to its location.
Real-time data
Includes current wave height and direction, water and air temperature, atmospheric pressure and sea level.
Marine forecast for the coming days
The marine forecast table shows the next 7 days hour by hour, from 06h to 23h, using data from Open-Meteo's wave and weather models. Each column is one hour, and each day starts with its abbreviated weekday and date (for example, SUN 08/11). On mobile, scroll the table horizontally to see the remaining hours.
What each forecast row means
The rows are grouped into four blocks separated by a line: total waves, swell, wind and water temperature. When a value is not available for an hour, a dash (-) is shown.
- Hour
- Local time at the spot that the column's data refers to.
- Wave bar
- Shows the total wave height. Its size is relative to the highest wave of the whole week, so you can see at a glance which hours and days will be bigger. The colour shows the height: blue up to 0.9 m, orange between 0.9 and 1.5 m, and red from 1.5 m.
- Wave height (m)
- Significant height of the total waves, in metres. It combines wind sea (waves generated by the local wind) and swell (waves generated far away). Significant height is the average of the highest third of the waves, so during a session you will see many smaller waves and some sets bigger than this value.
- Wave direction
- Mean direction the total waves come from. The arrow points where the waves are travelling to: an arrow pointing down means waves coming from the north. Tap or hover over it to see the value in degrees (0° = north, 90° = east, 180° = south, 270° = west).
- Wave period (s)
- Mean time in seconds between two consecutive waves of the total waves. The longer the period, the more energy the waves carry and the more organised they arrive.
- Swell height (m)
- Significant height of the primary swell, in metres. These are waves generated by distant storms, which reach the coast cleaner and more organised than wind sea. It is usually the most important figure to know whether there will be surfable waves.
- Swell direction
- Mean direction the primary swell comes from, shown the same way as the wave direction. Compare it with the spot's orientation: a swell that hits the spot head-on works much better than one blocked by the coast.
- Swell period (s)
- Mean time in seconds between waves of the primary swell. As a guide, below 8 s the swell is usually weak, between 8 and 12 s it is good for surfing, and above 12 s it arrives with a lot of power.
- Wind (Km/h)
- Mean wind speed 10 metres above the surface, in kilometres per hour. With light wind (under 10 km/h) the sea is usually cleaner; strong wind deforms the waves, especially when it blows from the sea.
- Gusts (Km/h)
- Maximum wind gust 10 metres above the surface during the previous hour, in kilometres per hour. A big difference between gusts and mean speed means gusty, irregular wind.
- Wind direction
- Direction the wind blows from. As with the waves, the arrow points where the wind is going. Land wind (offshore) cleans up and holds the waves open, while sea wind (onshore) makes them messy.
- Water temp. (°C)
- Sea surface temperature, in degrees Celsius. It helps you choose your wetsuit thickness. This value changes slowly and the model updates it less often than waves and wind.
Each spot's own characteristics
Every spot has its own orientation, seabed type and tide range in which it works best, so the same forecast can give different results depending on the spot.