How to read the wave tables
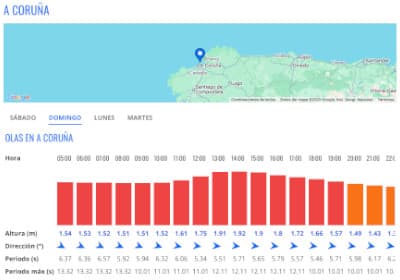
Wave tables show the hour-by-hour forecast for the coming days at a specific point on the coast, combining wave, wind and tide data.
Height, period and direction
Just like with buoys, height indicates the average wave size, period indicates quality and spacing, and direction shows where the swell is coming from. Together, these three figures determine whether a spot is going to work well.
Local wind
Offshore wind (blowing from land to sea) tends to groom the waves and improve their quality; onshore wind (from sea to land) tends to make them messy and choppy.
Tides
Many spots work best at a particular tide stage. Check the high and low tide times and levels to know when your favourite spot usually breaks best.
How to read the table
Scroll horizontally to see the forecast for every hour of the day, and browse between days to plan your session ahead of time.