How to read the buoy data
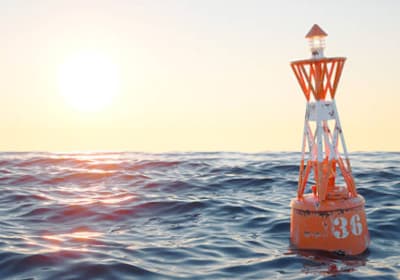
Puertos del Estado's coastal buoys measure the state of the sea in real time at the exact point where they're anchored. They're the most reliable source for knowing how the sea is right now.
Wave height (m)
Shows the average height of the waves recorded by the buoy. It's not the height of the biggest wave, but a statistical average of the swell at that moment.
Period (s)
The period is the time between one wave passing and the next. Long periods (10-16 s) usually indicate ground swell with more energy and quality; short periods (under 8 s) are usually local wind swell, which tends to be messier.
Direction (°)
Shows where the swell is coming from, in degrees from north. It's key to knowing whether that direction will reach your usual spot well, or whether it will be blocked by the coastline or a headland.
Real-time data
Unlike maps and tables, which are forecasts, buoy data is measured live, making it the best reference to check whether the forecast is actually holding up.
Table rows
Each column is one buoy reading and each row is one measured value. Tap the info icon next to each row name for a quick explanation.
- Hour
- Local time when the buoy recorded the column's data. Buoys send a reading every hour, and the first column is the most recent state of the sea.
- Waves height (m)
- Significant wave height measured by the buoy, in metres: the average of the highest third of the waves. You'll see plenty of smaller waves and the odd set bigger than this value.
- Waves direction (°)
- Average direction the swell is coming from. The arrow points where the waves are travelling: an arrow pointing down means swell coming from the north. Tap or hover over it to see the value in degrees (0° = north, 90° = east, 180° = south, 270° = west).
- Waves period (s)
- Average time in seconds between two consecutive waves. The longer it is, the more powerful and organised the waves arrive.
- Waves max period (s)
- Period of the most widely spaced waves recorded by the buoy. If it's much longer than the average period, a stronger ground swell is mixed with wind swell.
- Wind speed (km/h)
- Average wind speed measured at the buoy, in kilometres per hour. Below 10 km/h the sea is usually cleaner.
- Wind direction (°)
- Direction the wind is blowing from, shown the same way as the swell. Offshore wind grooms the waves and onshore wind messes them up.
- Water temp. (°C)
- Sea surface temperature, in degrees Celsius. It helps you choose your wetsuit thickness.
- Air temp. (°C)
- Air temperature measured at the buoy, in degrees Celsius.